Tomorrow is election day. At this point, the probability is vanishingly small that any single fact checked statement from any of the 2012 presidential or vice presidential candidates could sway anyone's decision. It's similarly unlikely that an analysis of the aggregate truthfulness of the candidates will influence votes. Since everyone's already decided, now is a good time to reflect. On the malarkey scale, how do the presidential candidates this election year compare to the candidates in 2008? Specifically, did the candidates spew more malarkey or less? I'll use Malark-O-Meter's factuality scale and statistical analysis tools to address this question. The question is an important one because it gives us some insight into how the shifts in political climate since Obama entered office have influenced campaign politics.
The malarkey score uses fact checker rulings from PolitiFact's Truth-O-Meter, The Washington Post's Fact Checker's Pinocchio scale, or both to measure the average falsehood of the statements that individuals or groups make. These organizations rate the factuality of statements using categories that range from true to false. Malark-O-Meter turns these categories to numbers, then averages the numeric rating of an individual's or group's statements. The result is a score that ranges from 0, which suggests that 0% of what comes out of your mouth is malarkey, to 100, which suggests that 100% of what you say is malarkey. For more details on its calculation, read this. For caveats to the validity of this measure, read this. For a justification of comparing truthfulness among individuals like I do, read this.
Karen S. at Politi-Psychotics shared with me her collection of all PolitiFact rulings for Obama, Biden, Romney, Ryan, McCain, and Palin. I used that data to construct a malarkey score that estimated the falseness of Obama, Biden, McCain, and Palin as of October 30, 2008. I would have included The Fact Checker's rulings, but Kessler's column wasn't a permanent part of WaPo until 2011, and I was unable to collect all the necessary data in time for the eve of election. To calculate the malarkey scores for the 2012 candidates, I calculate the malarkey score separately for their Truth-O-Meter report cards as of October 30, 2012.
You might wonder why I don't limit the scope of the 2012 malarkey scores to the campaign season. It's because I'm not trying to measure the malarkey spewed during a campaign season. I'm trying to measure the overall factuality of a presidential hopeful. Back in 2008, Obama and Biden might have been more or less factual than they have become in the last four years. Yet we shouldn't be blind to the malarkey that they or the two 2012 Republican candidates spewed before 2011. Moreover, we shouldn't punish candidates back in 2008 for statements that they haven't made yet.
With those caveats out of the way, let's see what the observed malarkey scores are before measuring our statistical uncertainty in them. Our aim is to get a better understanding of how our beliefs about the factuality of the two campaigns compare at identical points in their history.
2008 candidates
| 2012 candidates
|
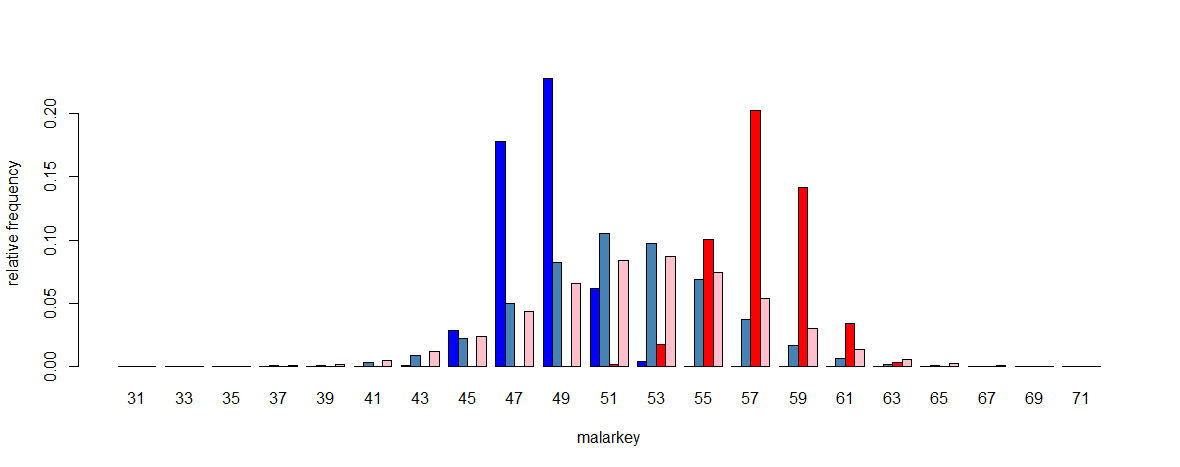
If you take the observed data at face value, it suggests that there are some candidate-level differences between the two election years. The differences aren't big. Still, in four years, the candidates range between zero and 12 percent more full of malarkey in 2012 than their counterparts in 2008. Curiously, the data also suggests that, according to her PolitiFact report card, Palin spewed less malarkey during the campaign than McCain (my how things have changed since then). But with what degree of certainty can we make such statements given the evidence we have? Enter Malark-O-Meter's statistical methods for estimating and comparing malarkey scores.
Basically, we treat fact checker report cards as a sort of experiment that gauges the factuality of a particular candidate. Because fact checkers only rate a small number of individuals' statements, there's uncertainty in these measures that arises from sampling error. This is particularly important because sampling error is higher in smaller samples. There were fewer statements collected for Obama in 2008 than in 2012, which would increase our level of uncertainty in the comparisons we'd make between Obama's performance in the two years. The number of statements that have been fact checked also differ across the four candidates, with presidential candidates fact checked more than vice presidential candidates and Democratic candidates fact checked more than Republican candidates.
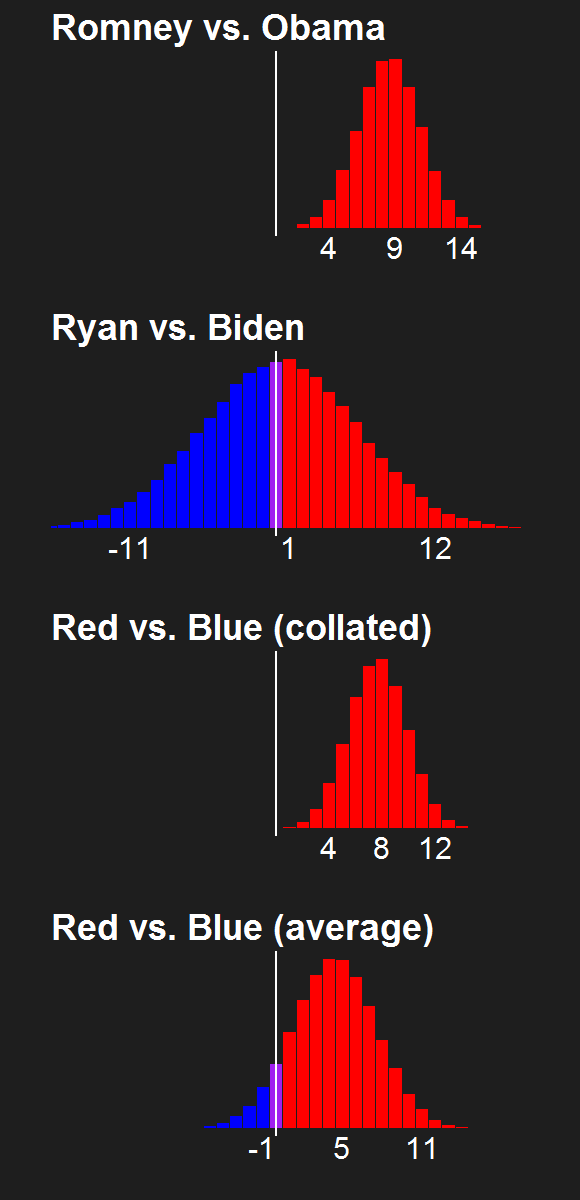
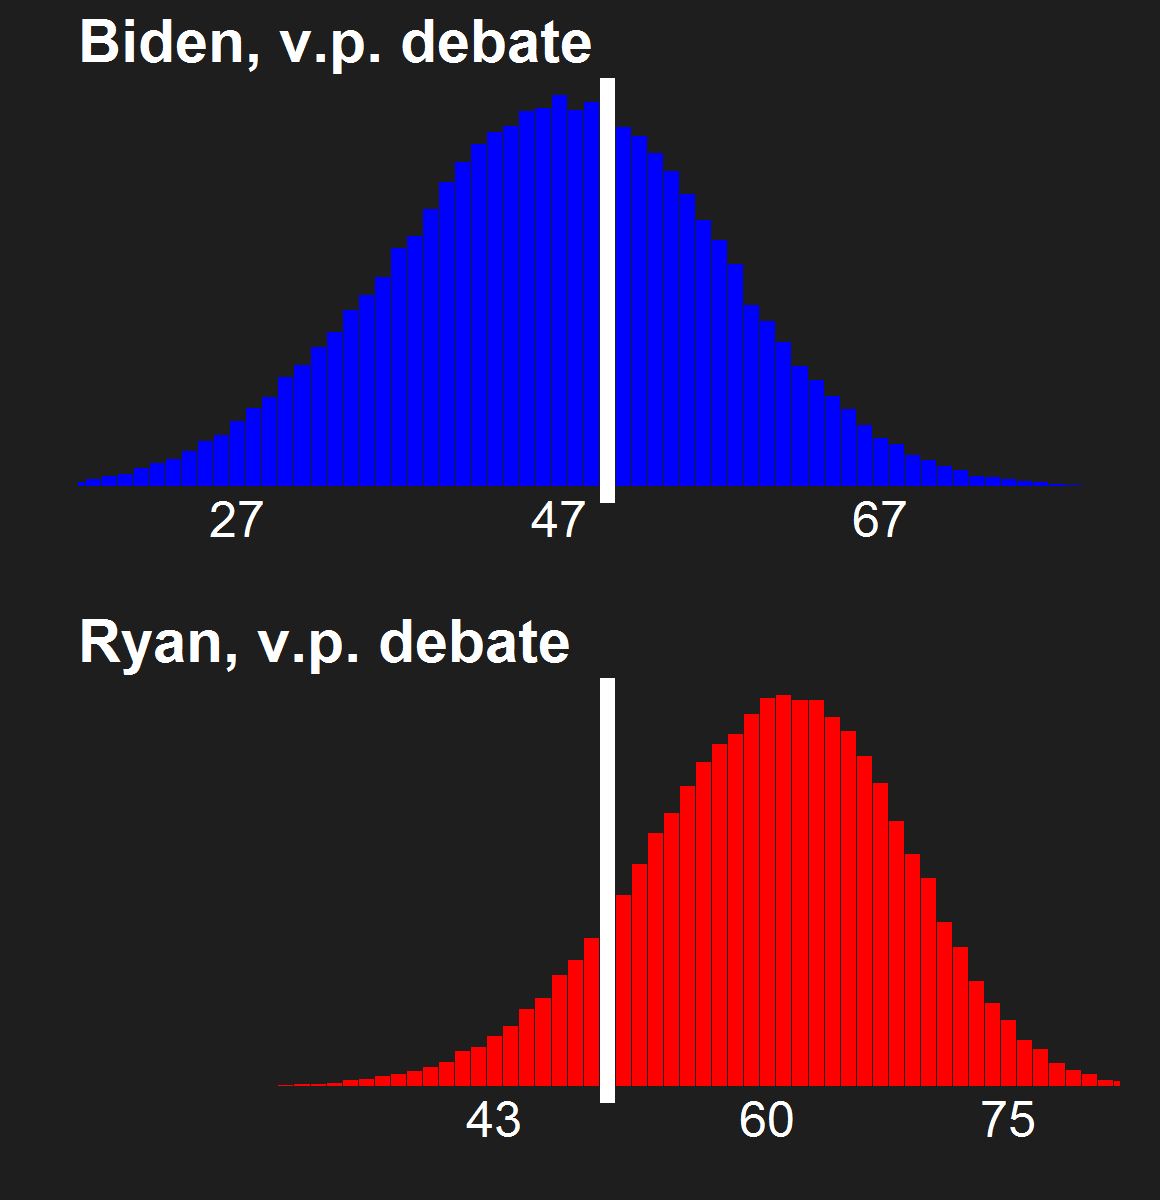
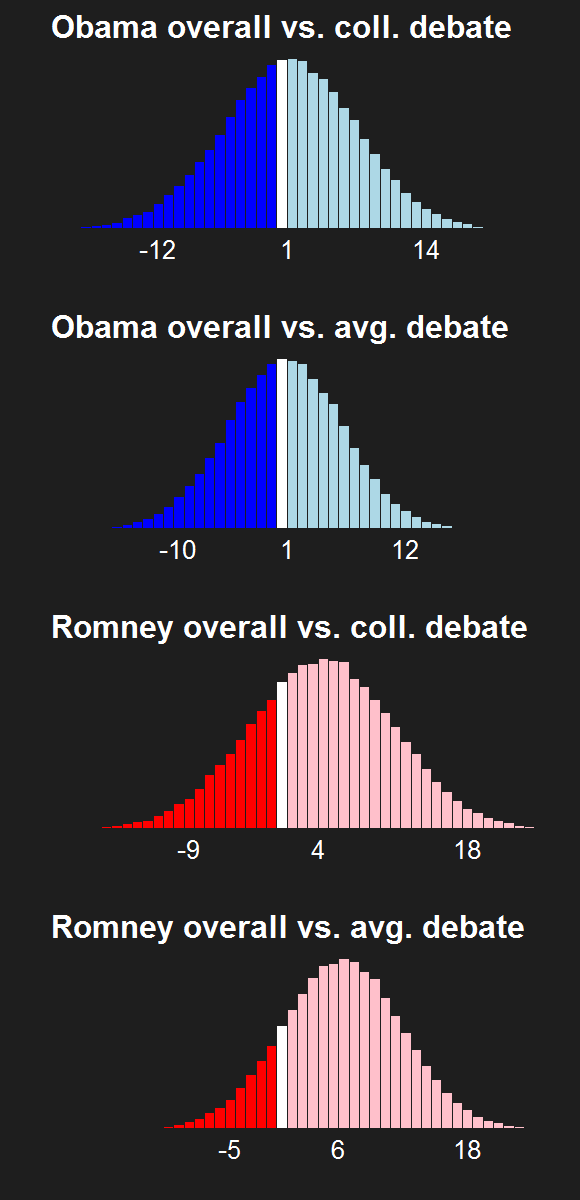
Anyway, we can use probability theory to simulate the universe of possible malarkey scores given the data that fact checkers have collected, then estimate the likelihood that a candidate's malarkey score is a particular value. Let's start with the observation that each candidate's malarkey scores from 2012 were higher than the malarkey scores of their counterparts in 2008.
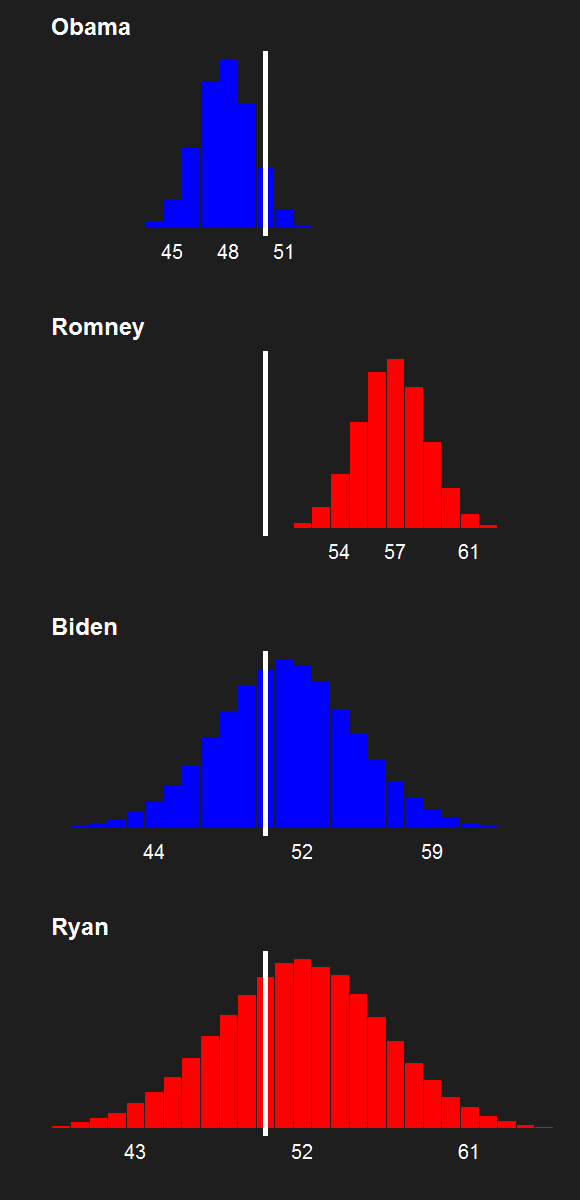
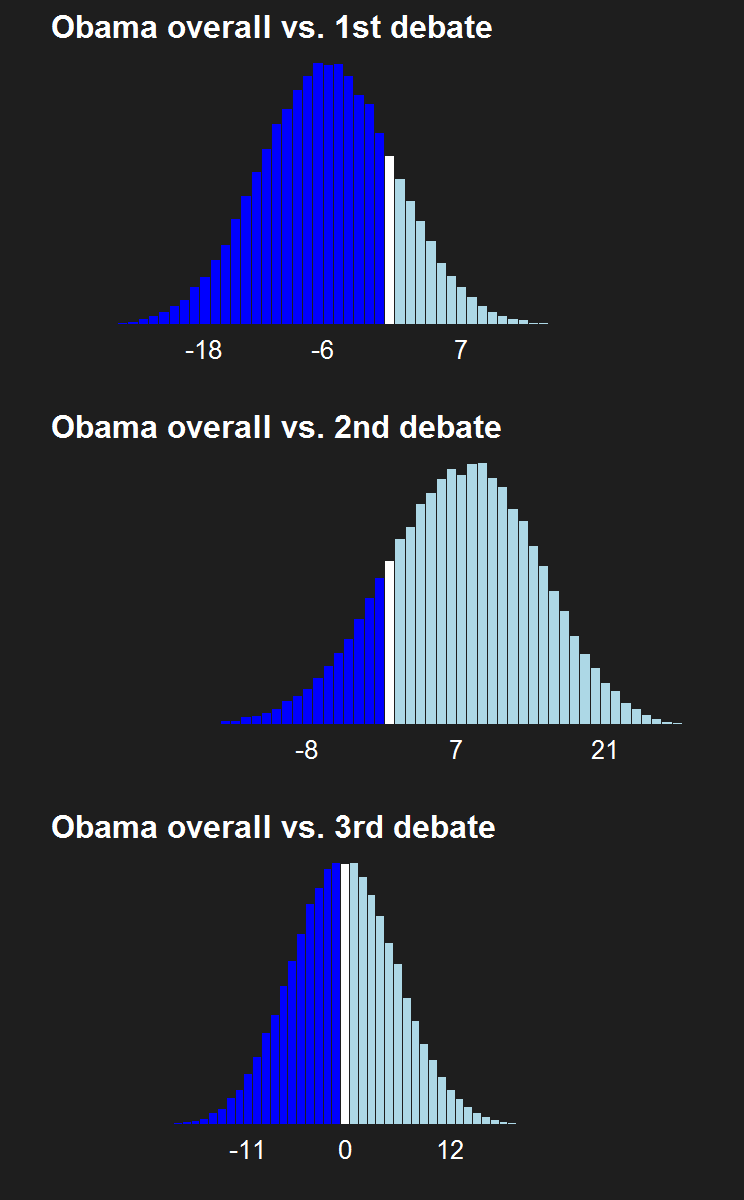
It turns out that we can be 95% confident that Barack Obama's malarkey score was between 6% percent smaller and 14% larger going up to this election year than it was up to 2008. The odds are about 3 to 1 that if we repeated this experiment, we'd find Obama to have spewed more malarkey by 2012 than he had by 2008.
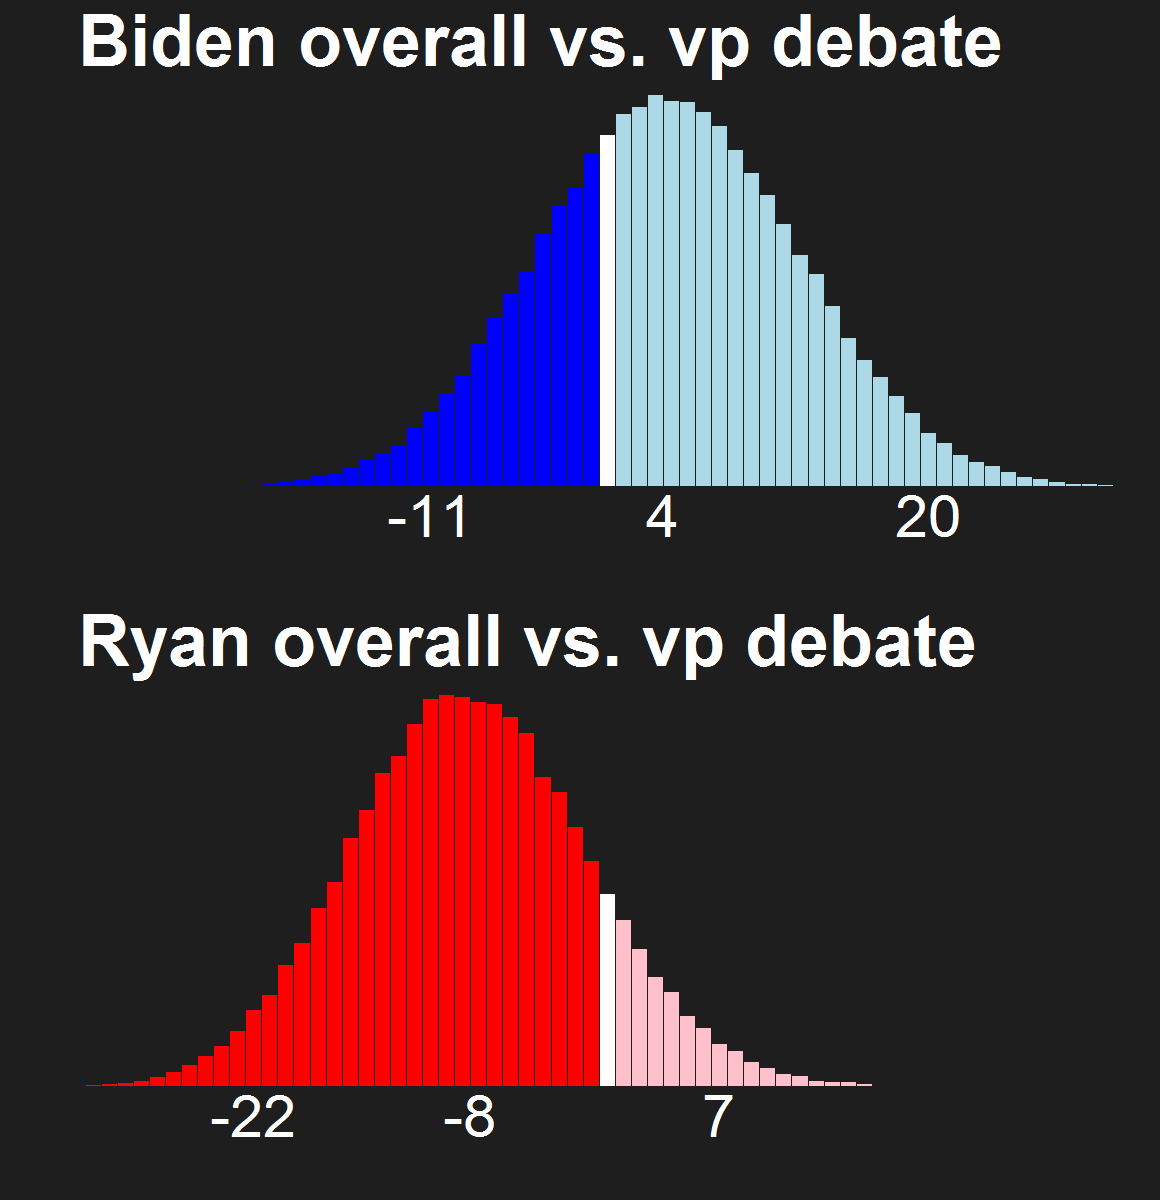
The comparison isn't as clear for Biden because we have less data than we do for Obama. We can be 95% confident that Biden's malarkey score was between 18% smaller and 24% larger by 2012 than it was by 2008. If we repeated this experiment, it is a coin toss whether we'd again find that Biden spewed more or less malarkey in 2012 than 2008. So we can't tell a difference between Biden 2008 and Biden 2012.
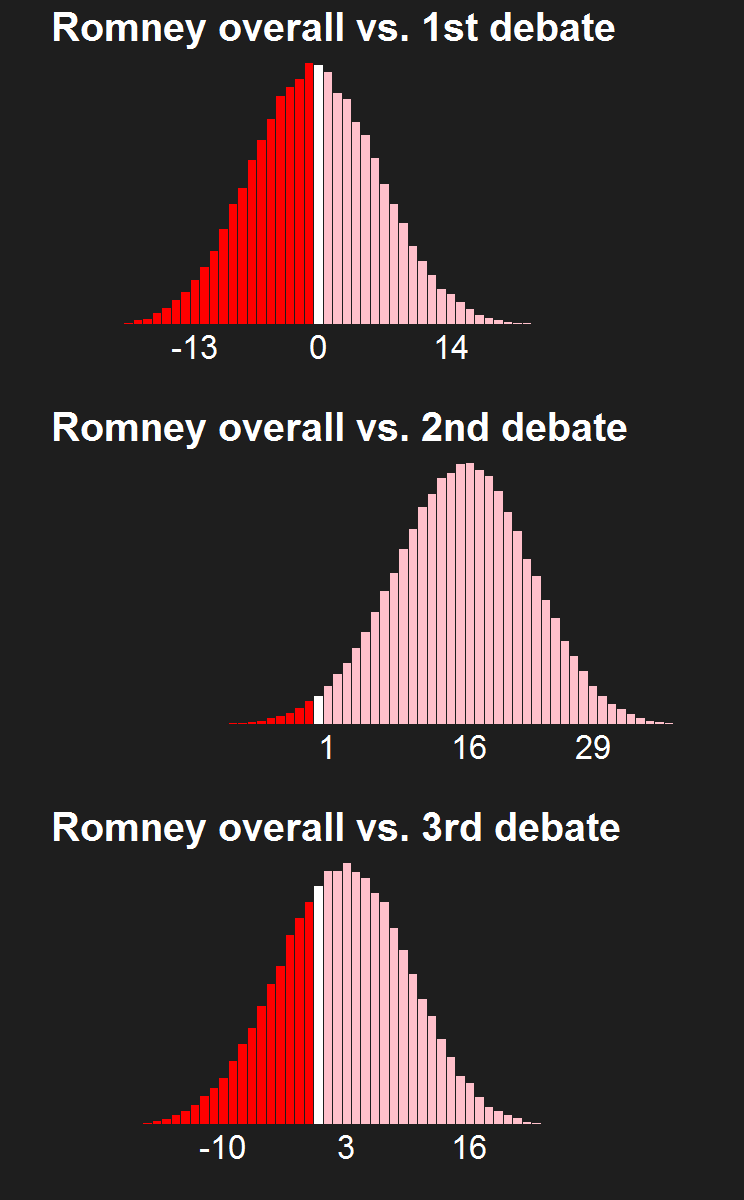
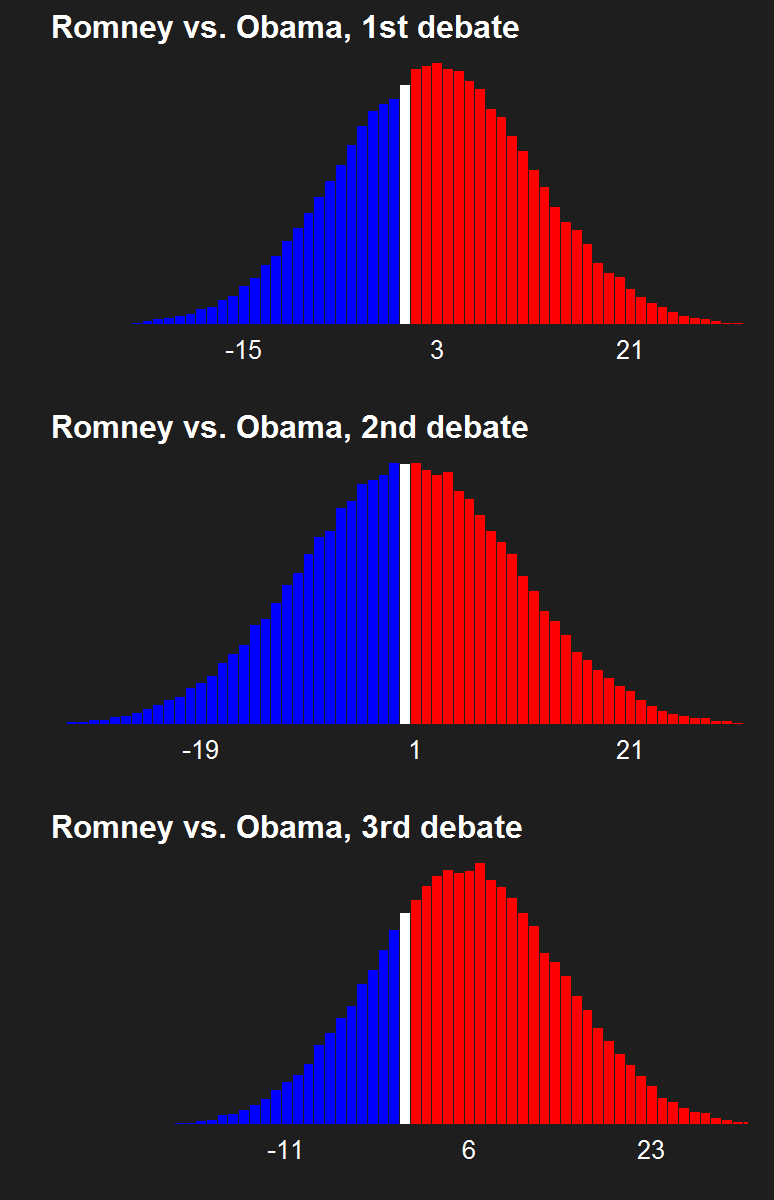
Is Romney today more or less truthful as a Republican presidential candidate than McCain was by 2008? We can be 95% confident that Romney's malarkey score was between 6% smaller and 13% larger by 2012 than McCain's was by 2008. The odds are about 3 to 1 that if we did this experiment again, we'd find Romney to have spewed more malarkey by 2012 than McCain had by 2008.
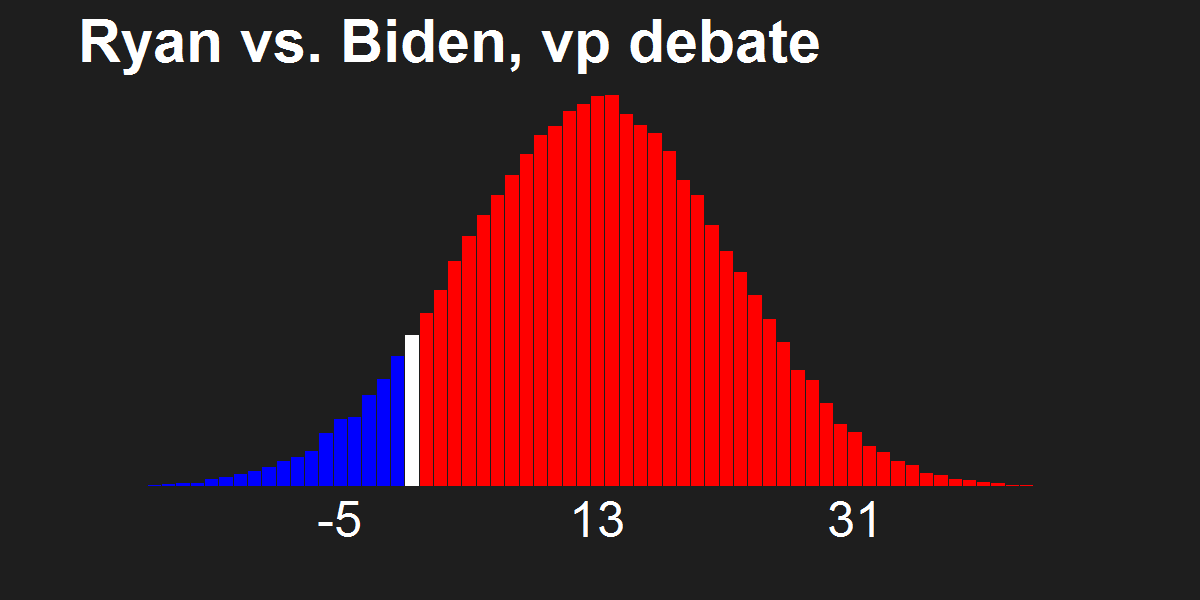
Is Ryan more or less truthful as a Republican presidential candidate than Palin was in 2008? We can be 95% certain that Ryan's malarkey score was between 5% smaller and 56% larger by 2012 than Palin's was by 2008. The odds are better than 15 to 1 that Ryan spewed more malarkey by 2012 than Palin had by 2008.
The finding about Ryan and Palin strikes me because Palin has spewed numerous falsehoods in her selfish bid for wingnut fame since the 2008 election. Yet Ryan is touted as the facts man of the GOP. Remember, however, that Palin hadn't gone rogue until late in the campaign, and her truthiness has only exploded since then. Moreover, the story in 2008 wasn't so much that Palin was false. It was more that she didn't know her ass from her elbow (which is a reminder that factuality isn't the only important characteristic to look for in a candidate). Recall that in the 2008 vice presidential debate, she said little that was even worthy of fact checking. By comparison, Ryan's rhetoric makes fact checkers salivate because he often ties numbers and report findings to his arguments. He's actually quite knowledgeable, albeit bullshittingly so.
That's the picture for the individual positions on the campaign ticket. What is the picture for the tickets as a whole? Here are the observed collated malarkey scores for the party tickets in 2008 versus 2012. For each party, collated malarkey sums up the statements in each category that the two members of a ticket made. For this reason, collated malarkey measures the average amount of malarkey in the statements made collectively by the members of a ticket.
Basically, we treat fact checker report cards as a sort of experiment that gauges the factuality of a particular candidate. Because fact checkers only rate a small number of individuals' statements, there's uncertainty in these measures that arises from sampling error. This is particularly important because sampling error is higher in smaller samples. There were fewer statements collected for Obama in 2008 than in 2012, which would increase our level of uncertainty in the comparisons we'd make between Obama's performance in the two years. The number of statements that have been fact checked also differ across the four candidates, with presidential candidates fact checked more than vice presidential candidates and Democratic candidates fact checked more than Republican candidates.
Anyway, we can use probability theory to simulate the universe of possible malarkey scores given the data that fact checkers have collected, then estimate the likelihood that a candidate's malarkey score is a particular value. Let's start with the observation that each candidate's malarkey scores from 2012 were higher than the malarkey scores of their counterparts in 2008.
It turns out that we can be 95% confident that Barack Obama's malarkey score was between 6% percent smaller and 14% larger going up to this election year than it was up to 2008. The odds are about 3 to 1 that if we repeated this experiment, we'd find Obama to have spewed more malarkey by 2012 than he had by 2008.
The comparison isn't as clear for Biden because we have less data than we do for Obama. We can be 95% confident that Biden's malarkey score was between 18% smaller and 24% larger by 2012 than it was by 2008. If we repeated this experiment, it is a coin toss whether we'd again find that Biden spewed more or less malarkey in 2012 than 2008. So we can't tell a difference between Biden 2008 and Biden 2012.
Is Romney today more or less truthful as a Republican presidential candidate than McCain was by 2008? We can be 95% confident that Romney's malarkey score was between 6% smaller and 13% larger by 2012 than McCain's was by 2008. The odds are about 3 to 1 that if we did this experiment again, we'd find Romney to have spewed more malarkey by 2012 than McCain had by 2008.
Is Ryan more or less truthful as a Republican presidential candidate than Palin was in 2008? We can be 95% certain that Ryan's malarkey score was between 5% smaller and 56% larger by 2012 than Palin's was by 2008. The odds are better than 15 to 1 that Ryan spewed more malarkey by 2012 than Palin had by 2008.
The finding about Ryan and Palin strikes me because Palin has spewed numerous falsehoods in her selfish bid for wingnut fame since the 2008 election. Yet Ryan is touted as the facts man of the GOP. Remember, however, that Palin hadn't gone rogue until late in the campaign, and her truthiness has only exploded since then. Moreover, the story in 2008 wasn't so much that Palin was false. It was more that she didn't know her ass from her elbow (which is a reminder that factuality isn't the only important characteristic to look for in a candidate). Recall that in the 2008 vice presidential debate, she said little that was even worthy of fact checking. By comparison, Ryan's rhetoric makes fact checkers salivate because he often ties numbers and report findings to his arguments. He's actually quite knowledgeable, albeit bullshittingly so.
That's the picture for the individual positions on the campaign ticket. What is the picture for the tickets as a whole? Here are the observed collated malarkey scores for the party tickets in 2008 versus 2012. For each party, collated malarkey sums up the statements in each category that the two members of a ticket made. For this reason, collated malarkey measures the average amount of malarkey in the statements made collectively by the members of a ticket.
2008 tickets (collated)
| 2012 tickets (collated)
|
Again, it looks like there are small differences between the two years. Let's see what statistical confidence we can place in that assessment.
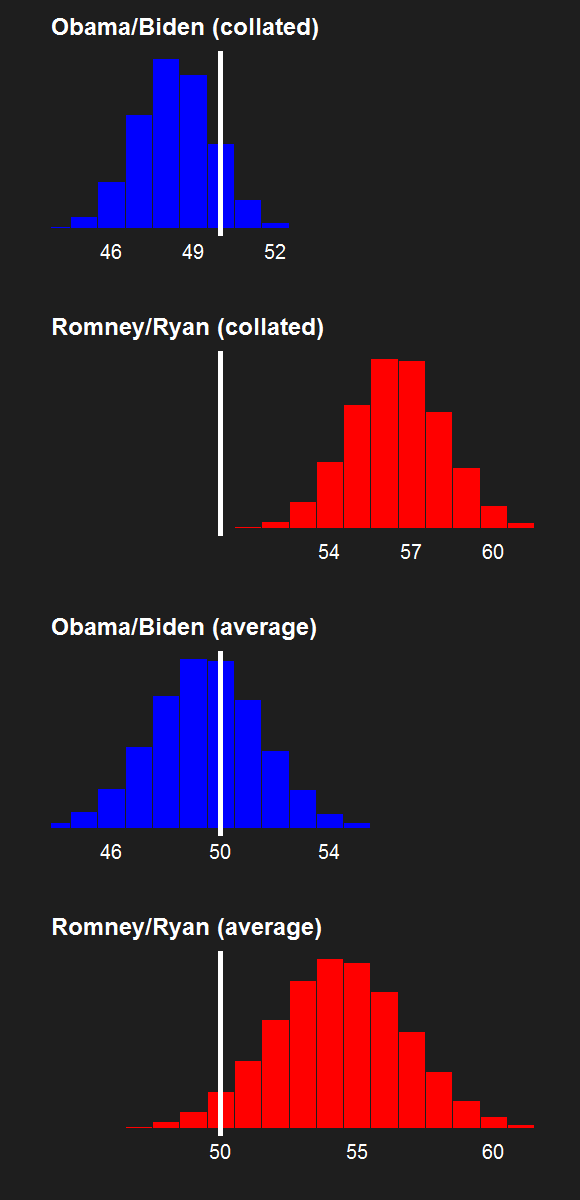
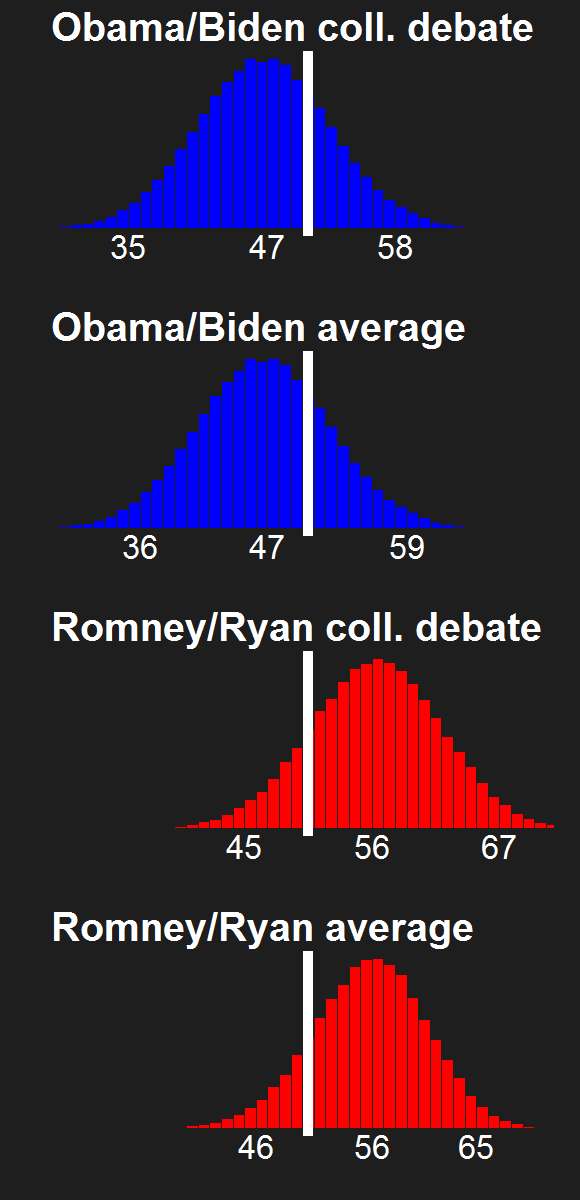
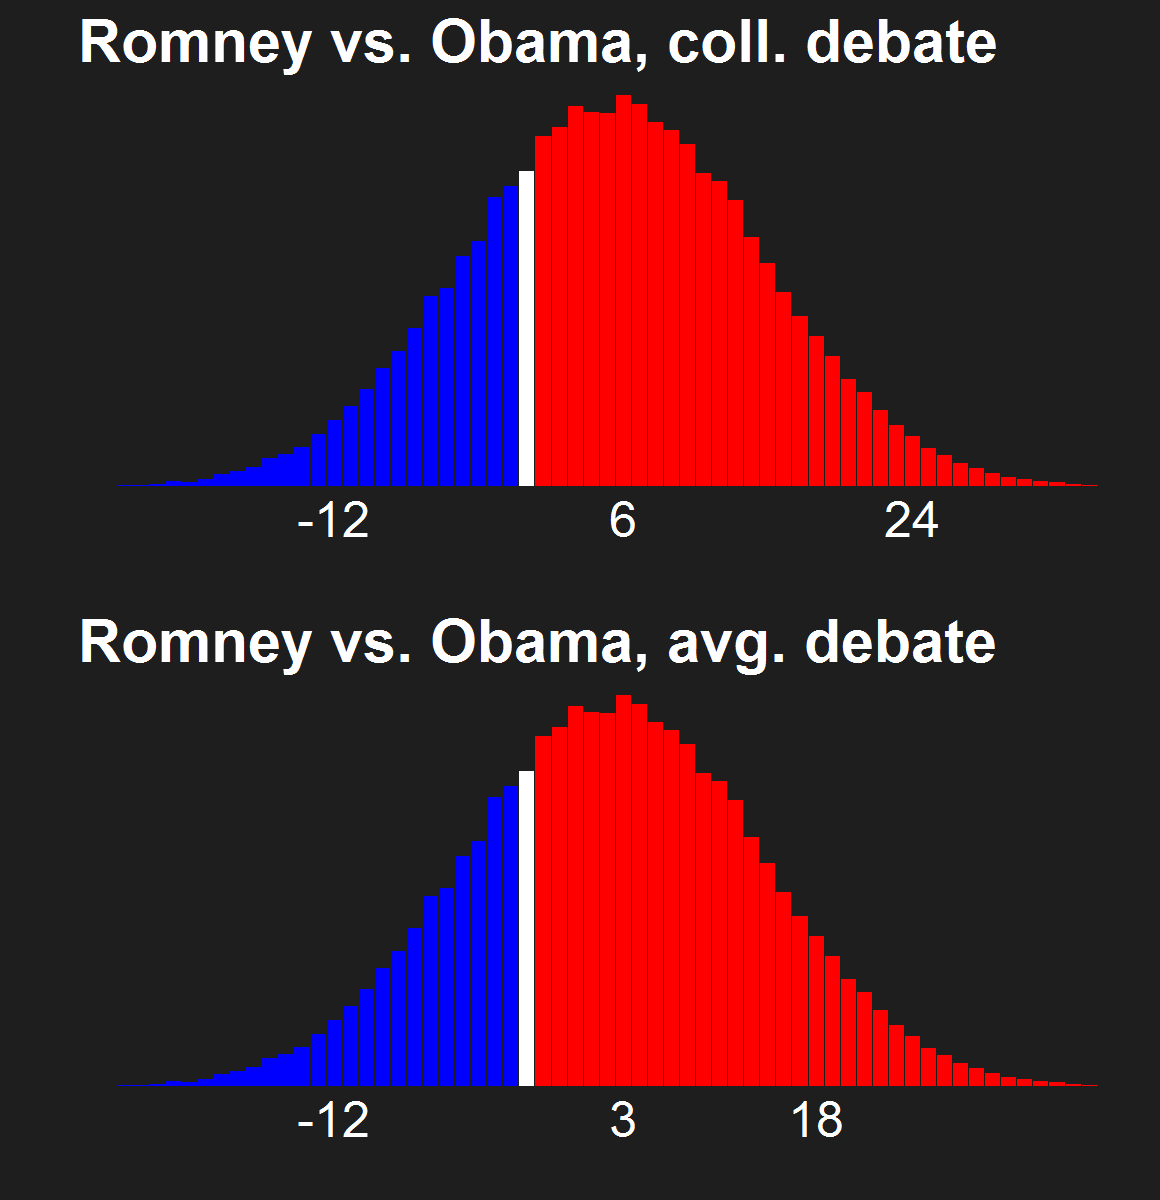
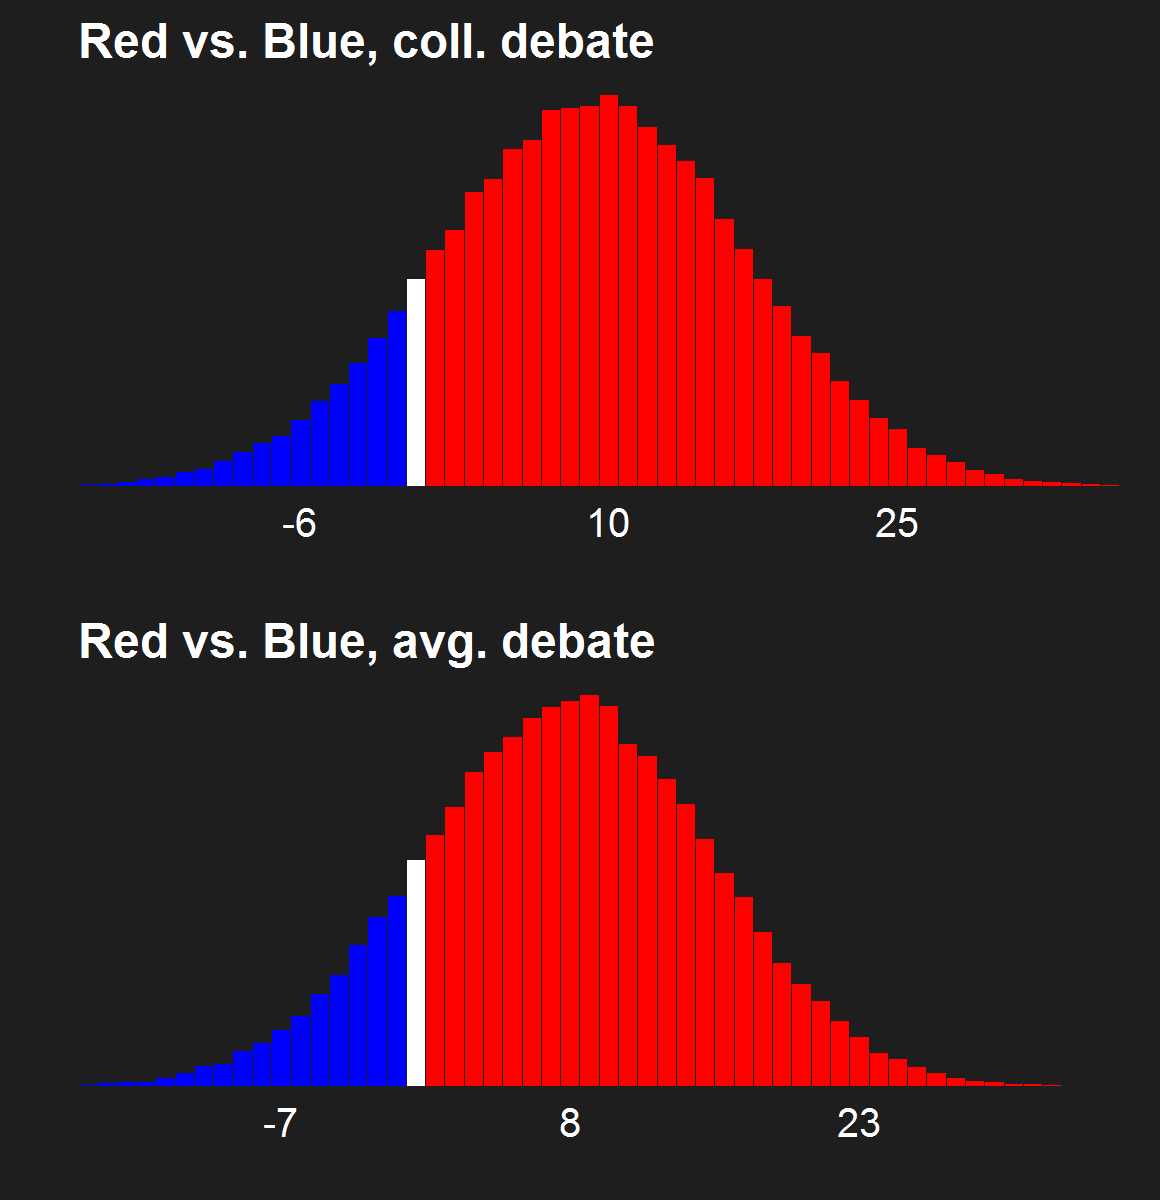
We can be 95% certain that Obiden's collated malarkey score is between 6% smaller and 13% larger by 2012 than it was by 2008. If we repeated this experiment, the odds are a bit less than 5 to 2 that we would again conclude that Obiden 2012 has spewed more malarkey than Obiden 2008.
What about Rymney versus McPalin? We can be 95% certain that Rymney's collated malarkey score is between 2% smaller and 18% larger by 2012 than McPalin's was by 2008. The odds are just under 19 to 1 that if we repeated this experiment, we'd find Rymney to have spewed more malarkey than McPalin.
At the ticket level, we can be fairly confident that each party's ticket collectively spewed more malarkey by election 2012 than its counterpart had by election 2008. Also note that we can be more certain that Rymney spews more malarkey than McPain than that Obiden 2012 spews more malarkey than Obiden 2008.
The collated malarkey score rates the average falsehood of the statements a ticket makes. What about the average falsehood of the members of each ticket? That's what the member average malarkey score measures. Simply calculate the malarkey for each candidate on a ticket, then average the malarkey scores of the candidates on that ticket. Here are the observed malarkey scores.
2008 tickets |
| ticket | malarkey |
|---|---|
| Obama/Biden | 42 |
| McCain/Palin | 54 |
2012 tickets
(member average)
| ticket | malarkey |
|---|---|
| Obama/Biden | 44 |
| Romney/Ryan | 55 |
Again, we observe small differences. Given the data, how certain can we be that these differences exist?
We can be 95% confident that Obama's and Biden's malarkey scores are on average between 10% smaller and 14% larger by the 2012 election than they were by the 2008 election. The odds are only about 3 to 2 that we're right in saying that Obama and Biden were on average more full of malarkey by 2012 than they were by 2008.
For the Republicans, we can be 95% confidence that Romney's and Ryan's are on average between 2% smaller and 27% larger by this election year than McCain and Palin were by election 2008. The odds are 19 to 1 that we'd be right in saying that Romney and Ryan were on average more full of malarkey by election 2012 than McCain and Palin were by election 2008.
Again, there is stronger evidence that the newest Republican ticket is less factual than the 2008 ticket than the evidence for Obiden 2012 being on average less factual than Obiden 2008. Except this time, the difference is in the average factuality of the members on each ticket. Together, these findings are consistent with Politi-Psychotics' evidence that Republicans have become less factual since Obama took office, a phenomenon that can't be interpreted as evidence that PolitiFact has become more partisan since its separation from Congressional Quarterly.
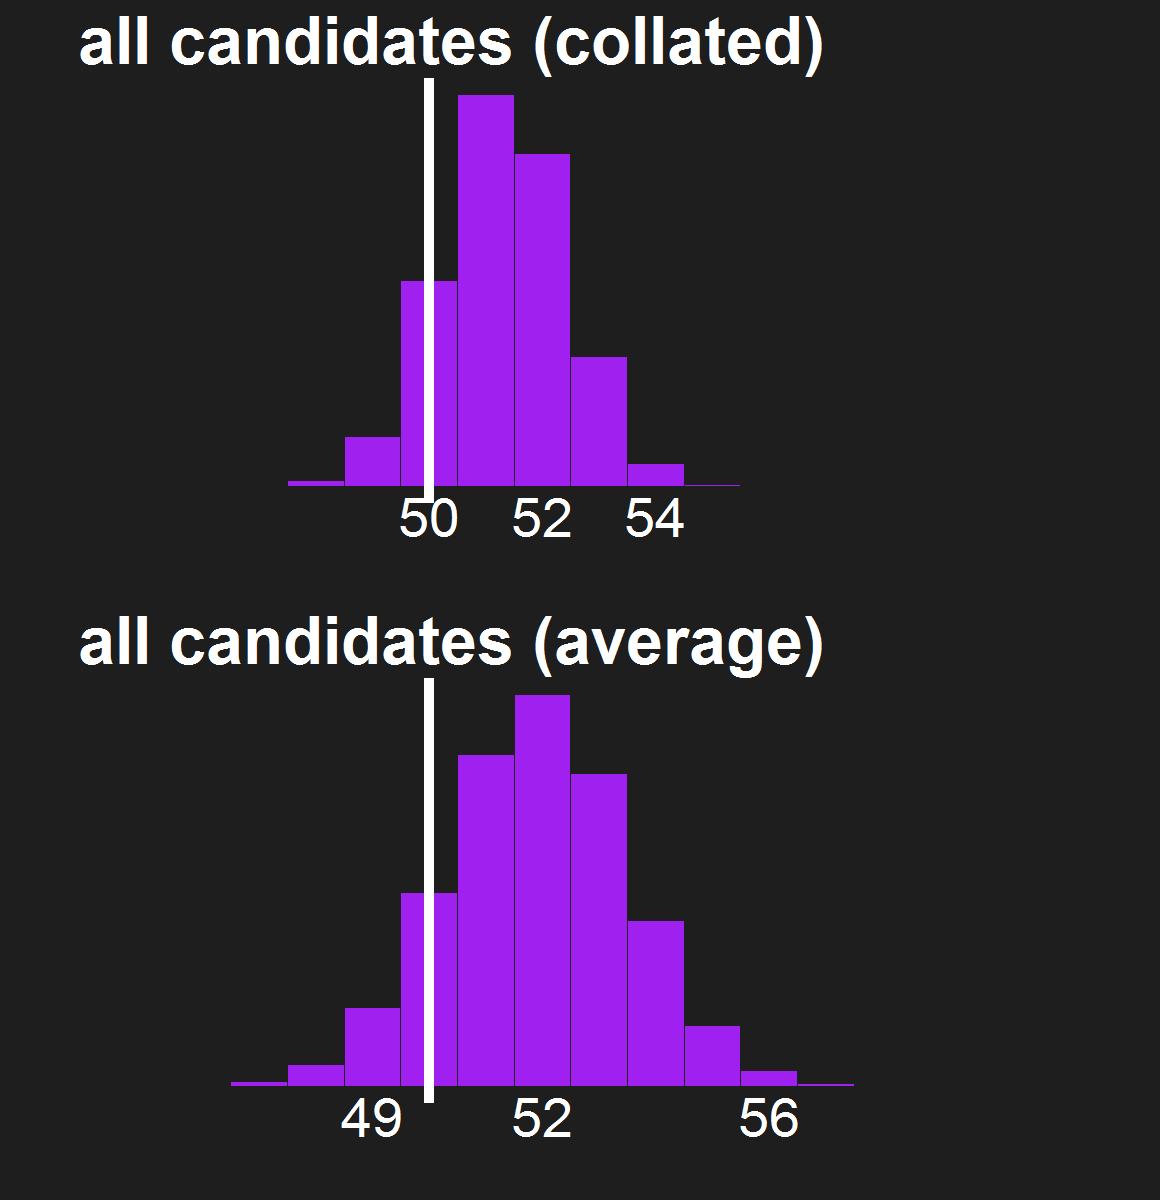
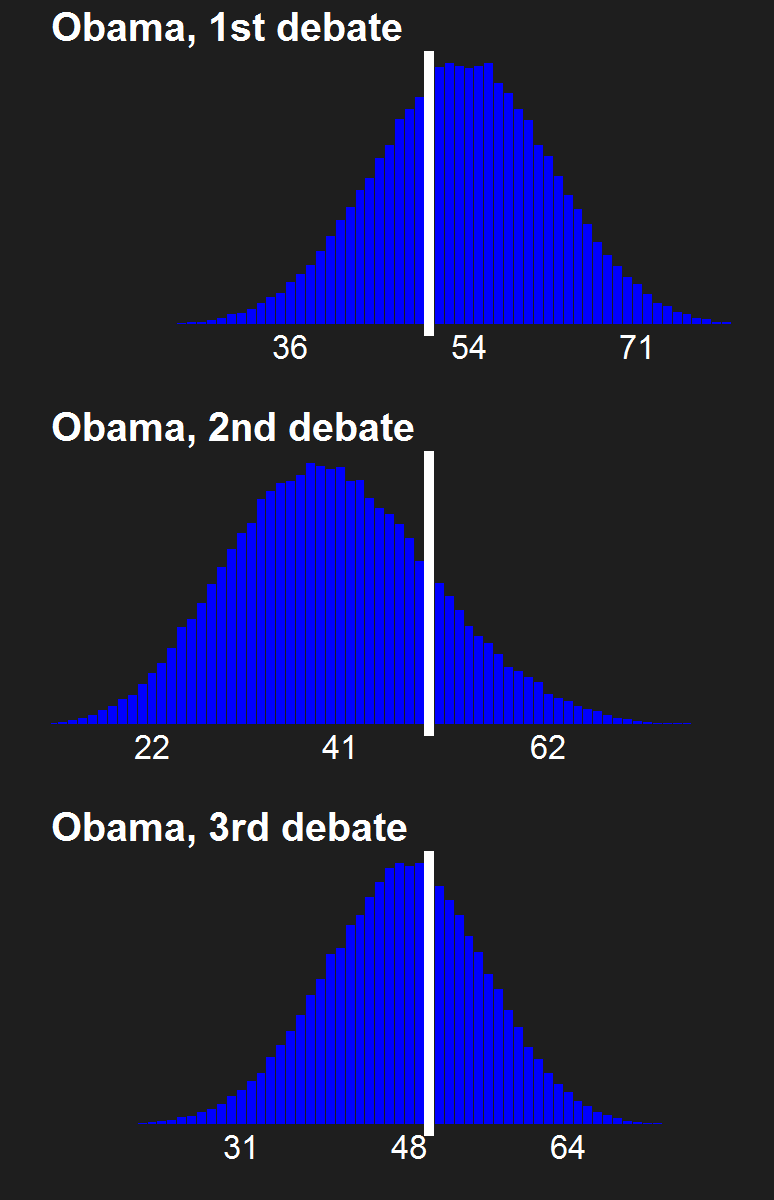
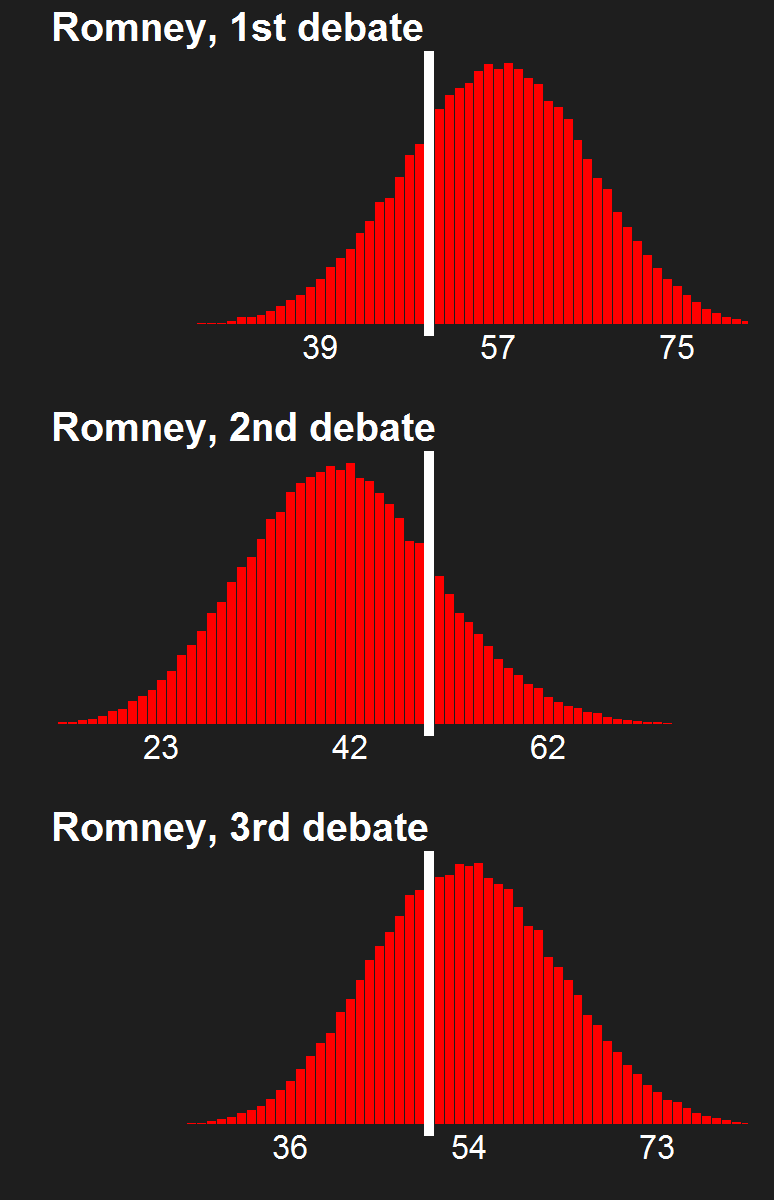
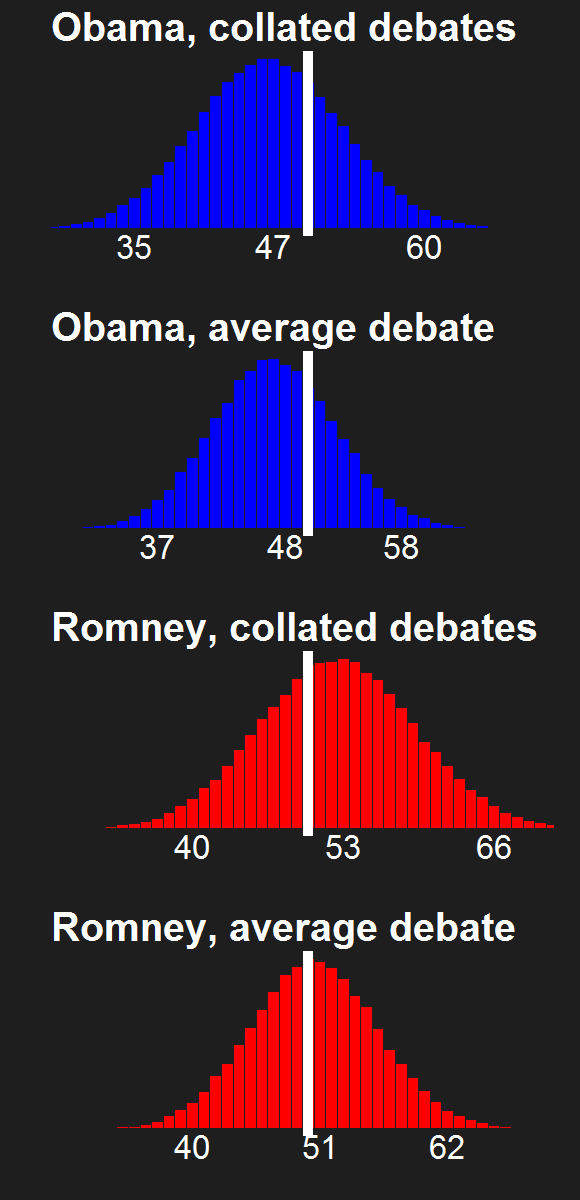
Two steps remain in this analysis, both pertaining to the overall truthfulness of the candidates in each election year. First, let's compare the collated malarkey score of all candidates, regardless of party, between election 2008 and election 2012 (remember, collated scores add up all the statements in each categories for all the individuals included, then calculate a malarkey score from the collated report card). For both years, the collated malarkey score for all 2008 candidates is 48, just under half full of malarkey (actually, the malarkey scores are very slightly smaller for the 2008 election, but we round up to the nearest whole number). We might as well toss a coin to decide whether the candidates's statements were collectively more or less full of malarkey running up to the 2012 election than the 2008 election.
The differences are clearer when we look at the average malarkey score of the candidates by election year. In 2008, the candidates were on average 42% full of malarkey. The 2012 candidates are on average 44% full of malarkey. How statistically confident can we be in saying that the 2008 candidates were on average more truthful than the 2012 candidates? Sadly, we can be about 92% confident in this conclusion.
The difference in the candidates' average malarkey between this election year and eleciton 2008 is only two points on the malarkey scale. Yet if the trend continues over the next four presidential elections, then most of what our presidential and vice presidential candidates say could be false by the time my daughter can decide whether or not to give a president a chance at a second term. If the trend continues another six or seven elections after that, then my unborn grandchild will be choosing between two sets of liars.
So what explains the trend? There are at least two hypotheses. First, PolitiFact's rulings could have become tougher since 2008, I doubt this, but I can't rule it out completely without analyzing the full set of PolitiFact rulings.
An alternative explanation reflects current political reality. Our country has become increasingly polarized in recent years at the same time that the stakes of obtaining our country's highest political office have increased. Consequently, the premium on strategic deception is higher. This hypothesis is consistent with my finding that neither ticket has a solid record of factuality. The hypothesis also jives with the chilling fact that, as actor Rainn Wilson recently Tweeted,
We can be 95% confident that Obama's and Biden's malarkey scores are on average between 10% smaller and 14% larger by the 2012 election than they were by the 2008 election. The odds are only about 3 to 2 that we're right in saying that Obama and Biden were on average more full of malarkey by 2012 than they were by 2008.
For the Republicans, we can be 95% confidence that Romney's and Ryan's are on average between 2% smaller and 27% larger by this election year than McCain and Palin were by election 2008. The odds are 19 to 1 that we'd be right in saying that Romney and Ryan were on average more full of malarkey by election 2012 than McCain and Palin were by election 2008.
Again, there is stronger evidence that the newest Republican ticket is less factual than the 2008 ticket than the evidence for Obiden 2012 being on average less factual than Obiden 2008. Except this time, the difference is in the average factuality of the members on each ticket. Together, these findings are consistent with Politi-Psychotics' evidence that Republicans have become less factual since Obama took office, a phenomenon that can't be interpreted as evidence that PolitiFact has become more partisan since its separation from Congressional Quarterly.
Two steps remain in this analysis, both pertaining to the overall truthfulness of the candidates in each election year. First, let's compare the collated malarkey score of all candidates, regardless of party, between election 2008 and election 2012 (remember, collated scores add up all the statements in each categories for all the individuals included, then calculate a malarkey score from the collated report card). For both years, the collated malarkey score for all 2008 candidates is 48, just under half full of malarkey (actually, the malarkey scores are very slightly smaller for the 2008 election, but we round up to the nearest whole number). We might as well toss a coin to decide whether the candidates's statements were collectively more or less full of malarkey running up to the 2012 election than the 2008 election.
The differences are clearer when we look at the average malarkey score of the candidates by election year. In 2008, the candidates were on average 42% full of malarkey. The 2012 candidates are on average 44% full of malarkey. How statistically confident can we be in saying that the 2008 candidates were on average more truthful than the 2012 candidates? Sadly, we can be about 92% confident in this conclusion.
The difference in the candidates' average malarkey between this election year and eleciton 2008 is only two points on the malarkey scale. Yet if the trend continues over the next four presidential elections, then most of what our presidential and vice presidential candidates say could be false by the time my daughter can decide whether or not to give a president a chance at a second term. If the trend continues another six or seven elections after that, then my unborn grandchild will be choosing between two sets of liars.
So what explains the trend? There are at least two hypotheses. First, PolitiFact's rulings could have become tougher since 2008, I doubt this, but I can't rule it out completely without analyzing the full set of PolitiFact rulings.
An alternative explanation reflects current political reality. Our country has become increasingly polarized in recent years at the same time that the stakes of obtaining our country's highest political office have increased. Consequently, the premium on strategic deception is higher. This hypothesis is consistent with my finding that neither ticket has a solid record of factuality. The hypothesis also jives with the chilling fact that, as actor Rainn Wilson recently Tweeted,
Over 6 Billion was spent on 2012 political campaigns telling us how good they are with money & debt.
— RainnWilson (@rainnwilson) November 5, 2012
There's a figure more damning than any malarkey score.